Academy
  • Log in
  • Sign up
  • StockWatch
  • Lobby
  • Academy
  • Investing
    • Planning Your Investments Setting investment goals
    • 8 Steps to Financial Freedom
    • How to Get Out of Debt
    • Dollar Cost Averaging with Example Calculations
    • Which Credit Card Should I Get?
    • Can I Retire on 1 Million Dollars? Is it Enough?
    • Investment Vehicles Best way to invest your money?
    • How to Budget Your Money
    • Choosing a Finance Advisor
    • Asset Classes: Shares, property, fixed interest
    • The Magic of Compound Interest
  • Shares
    • Stock Market Investing and Share Market Tips
    • Short Selling Explained: What is Short Selling
    • How to Trade Like a Professional Trader
    • What are E Minis Futures? How do I Trade Them?
    • Diversification Learn how to diversify your portfolio
    • What Is Ethical Investing?
    • Creating a Trading Plan
    • The S&P/ASX 200 Index (XJO)
    • Choosing A Broker
    • Guard Your Portfolio With Defensive Stocks
    • How Much Do I Need To Invest In Shares
    • Investing VS Trading
    • What does ex dividend mean? How to ensure you receive your dividends
    • If I Could Only Invest In One Thing...
    • What Are Shares Dividends?
    • Dividend Imputation System & Franking Credits Explained Calculations
    • What is the 'Market'?
    • What Shares Should I Buy?
    • How to Buy Shares, placing an order
    • Building a Investment Portfolio Strategy
    • Trading the ASX 200 Index: ETFs, CFDs, Futures and Options
    • Creating a Trading System
    • Understanding the Share Language & Jargon of the Share Market
    • What are Income Stocks? Best Income Stocks for 2010
    • How To Pick Growth Stocks?
    • Wesfarmers (WES) vs Woolworths (WOW)
    • David Jones (DJS) VS Myer (MYR)
    • Benefits of Investing in Shares
    • How to Make Money In Shares
    • How to Treat Trading Like a Business
    • BHP vs RIO
    • Making Money In a Bear Market
    • Investing in Cloud Computing Stocks
    • High Dividend Stocks
    • Make Money Trading the Share Market
    • ANZ vs CBA vs NAB vs WBC
  • Funds
    • Managed Funds Choosing the best fund for you
    • S&P/ASX 200 ETFs: STW, IOZ, VAS
    • Managed Funds or Direct Shares
    • ETFs (Exchange Traded Funds)
    • Introduction to Index Funds
    • ETF Trading
  • Fundamental Analysis
    • Fundamental Analysis of Stocks: Qualitative Factors of the Company
    • Fundamental Analysis of Stocks: Qualitative Factors of the Industry
    • Fundamental Analysis: Quantitative Factors, Book and Price to Book Ratio
    • Fundamental Analysis: Quantitative Factors, Earnings Per Share (EPS)
    • Fundamental Analysis: Quantitative Factors, Price to Earning (P/E) and PEG
    • Fundamental Analysis: Quantitative Factors, Short Interest
    • Warren Buffett: A genius investor, a philanthropist, and a role model for citizens
    • Benjamin Graham: Father of value investing
    • Phillip Fisher
    • Peter Lynch
  • Technical Analysis
    • Charting
      • Technical Analysis: Charting: Line Chart
      • Technical Analysis: Charting: Bar Chart
      • Technical Analysis: How to Read a Candlestick Chart
      • Technical Analysis: How to Read Point and Figure Charts
      • Technical Analysis: How to Draw Trend Lines On A Stock Chart
      • Technical Analysis: What are Stock Gaps & How to Trade Them
      • Technical Analysis: How to Read & Trade Chart Patterns
    • Technical Analysis: The Secret of Moving Averages Explained
    • Learn How To Trade Support and Resistance Levels
    • Technical Analysis Indicators: Leading versus Lagging Indicators
    • Trend Following Indicators Part 1: What Is a Trend?
    • Trend Following Indicators Part 2: Trading The Average Directional Index (ADX)
    • Trend Following Indicators Part 3: The Directional Movement Index (DMI)
    • MACD Indicator Explained
    • Technical Analysis Momentum Indicators: ROC, Stochastic & RSI
    • The Relative Strength Index RSI Indicator Explained
    • Stochastic Indicator Explained
    • Momentum Following Indicators: The TRIX Indicator
    • Volume Following Indicators In Technical Analysis
    • Volume Indicators: On Balanced Volume (OBV) Indicator
    • Volume Indicators: Money Flow Index (MFI) Indicator Explained
    • Volume Following Indicators: Percentage Volume Oscillator (PVO) Indicator
    • Technical Analysis: Parabolic Stop and Reversal (PSAR) Indicator
    • Technical Analysis: Stop Loss & Trailing Stop Loss Orders
  • Commodities
    • Should I Invest in Gold? Pros and Cons of Precious Metal Investing
    • Should I Buy Gold Now?
    • Investing In Silver 7 Methods to Gain Exposure to Silver
  • Day Trading
    • Common Day Trading Myths and Lies Debunked
    • Day Trading Rules Part 1: Setup Long
    • Day Trading Rules Part 2: Setup Short
    • Buying and Selling With the Trend
    • Day Trading: The Art of Controlling Your Emotions Part 1
    • Day Trading: The Art of Controlling Your Emotions Part 2
    • Intermediate Setups and Creating a Bias Part 1
    • Intermediate Setups and Creating a Bias Part 2
    • The Art of Channel Trading
    • Day Trading Example: Walking Through a Trade – Part 1
    • Day Trading Example: Walking Through a Trade – Part 2
    • Can I Make Money Day Trading? How to Become a Day Trader?
    • Tracking the Market and Day Trading Your Stock
    • High Frequency Trading
    • What is a Trading Robot? Should I Use One to Trade?
  • Forex
    • How to Trade FOREX – Beginners Guide
    • Trading Forex
  • Derivatives
    • Options
      • Options Trading: Call Options Explained
      • Options Trading: Put Options Explained
      • Options Trading: Why Trade Options?
      • Components of an Option
      • Understanding Option Pricing Fundamentals
      • Options Trading Examples
      • Options Trading Strategies
      • Options Trading Risks
      • The Covered Call Strategy
      • Trading Options Seminars: What You Will Learn in a Teaser Seminar
    • CFDs
      • What are CFD's? Why Trade them?
      • CFD Types: Direct Market Access (DMA) VS Market Maker (MM) The Pros & Cons
      • CFD Margin Requirements Initial and Variation Margin.
      • CFD Trading: Calculating Overnight Interest Payments (Financing fees) with example
      • CFD Trading: CFD real life examples with calculations (Long & short)
      • The Pros & Cons of Trading CFDs
      • CFD Trading Risks: Learn the risks associated with trading CFDs
      • How to Choose the Best CFD Provider for You
      • CFD Trading Top 5 Trading Mistakes
      • CFD Tax Treatment
      • Learn How To Trade CFDs: Developing a system that should make us money
      • CFD Trading Example Flight Centre (FLT)

Technical Analysis: How to Draw Trend Lines On A Stock Chart

  1. Articles
  2. Technical Analysis
  3. Charting
  4. Draw Trend Lines
23 February 2011
ยท
4 min read

Series 5 articles

  • Technical Analysis: Charting: Line Chart
  • Technical Analysis: Charting: Bar Chart
  • Technical Analysis: How to Read a Candlestick Chart
  • Technical Analysis: How to Draw Trend Lines On A Stock Chart
  • Technical Analysis: What are Stock Gaps & How to Trade Them

The concept of a trend line is a simple one: connect two points together with a line. Correctly drawing it requires a bit more skill. The reason traders use a trendline is to plot a support and resistance level for stocks in a trend. For instance, if a stock is trending upwards, the chartist will be interested in how fast the stock is moving up over time.

He can see this if he properly draws a trendline.

Rules to Drawing a Trend Line for a Rising Stock

Because trend lines drawn on upwards and downwards trending stocks are slightly different, we will discuss them one at a time.

Below are the rules for drawing trendlines on stocks trending up.

  1. Use a logarithmic scale
  2. Find the lowest low.
  3. Find the highest high.
  4. Take the highest high and trace backwards to find the highest minor low before it.
  5. Draw a line connecting the lowest low to the chosen minor low without passing through any price data.

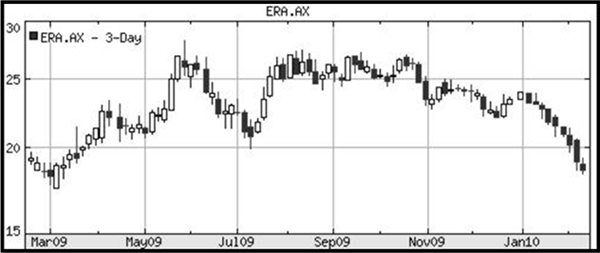
We will test these rules on the following stock chart Energy Resources (ERA)
how to draw a proper trendline

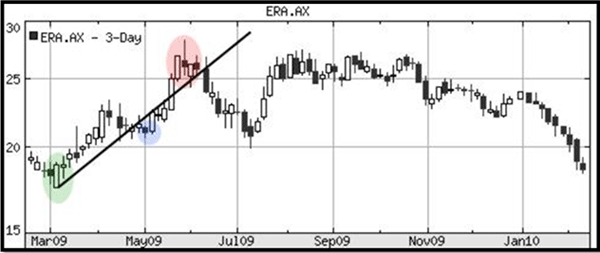
From March to June 2009 the stock was in an uptrend. The prices whipsawed for a few months and began a downtrend from October 2009 until the chart finishes in February 2010.

Because we are discussing an uptrend first, we will dissect March to June 2009.

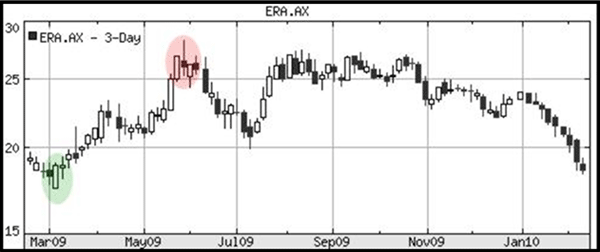
Steps one and two dictate that I need to find the lowest low and highest high. I have done so and colored them green and red respectively.
drawing a trendline

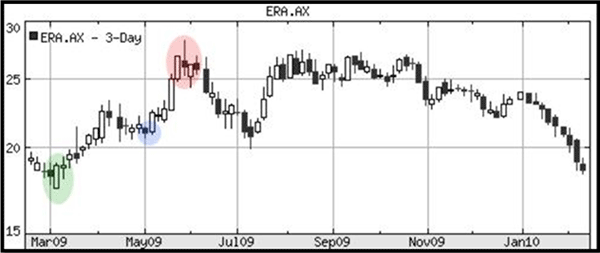
My next step requires that I trace backwards from the red circle or the highest high, and mark out the bottom of the dip. I have colored this portion blue.
Creating a proper trendline

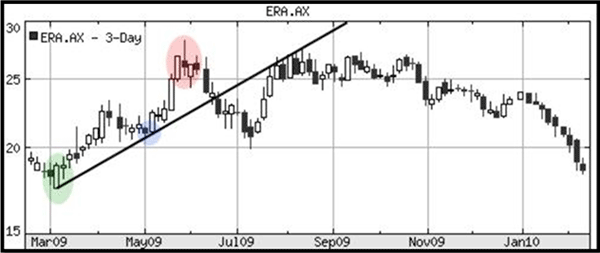
Now I am ready to draw my trendline. It is important that the trendline for an up trending stock is always beneath the price. It is a support propping up the stock prices. I will connect the green and blue portions making sure to draw on the bottom of the candlesticks.

This is how the trendline looks.
Drawing an uptrend - trendline

The stock bounced once off the trendline in May 2009. The price rose and crashed through the trendline in late June 2009. Interestingly, the price rose to touch the underside of the trendline in July and August of 2009. The trendline that created support will often become a resistance if the trend changes. More of this will be discussed later.

A rule of thumb that should be followed: try to pierce prices as few times as possible with your trendline. The chart below would be incorrect since the line goes right through the price values in May with little regard.
Improper trendline

Rules to Drawing a Trendline for a Falling Stock

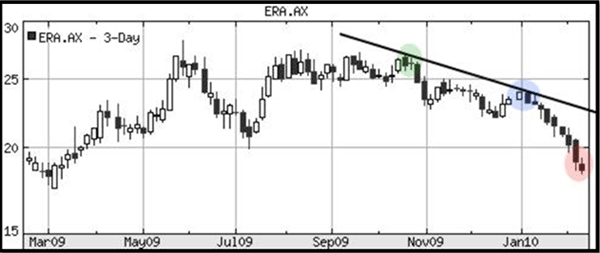
  1. Find the highest high (green)
  2. Find the lowest low (red)
  3. Trace backwards from the lowest low to find a minor high just preceding it (blue)
  4. Draw a trendline between the green and the red. Make sure the line is above the prices for a falling stock in a downtrend.
Downtrend: Drawing a trendline

The prices are pulling away fast from my trendline. The prices have fallen drastically in January. If the price continues to drop we will need to draw a new trendline starting at the beginning of January with a much steeper slope. On the other hand, it is altogether possible that the prices will rise to touch the trendline drawn at some future date.

Best Fit Trendlines

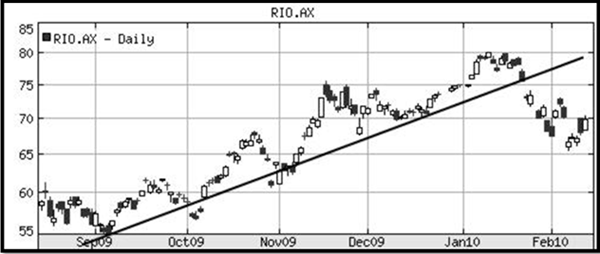
Sometimes it is quite difficult to perfectly fit the trendline without piercing price data as the chart below depicts. The trendline is underneath the correct low point in Sept 2009, and under the right spot in mid-December. But the prices have compromised our trendline twice. What can be done?
Rio Tinto: Drawing a trend line

If the trendline pierces the data very few times and the breach is shallow, you can continue to use the trendline. Nothing in this world will be a perfect fit.

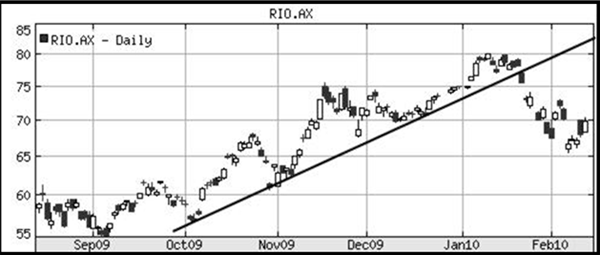
But if the trendline pierces the data on almost every price bounce, or at least 1/3rd the time, consider moving the trendline somewhat. In this instance, we can move the lowest point from September 2009 to October 2009 (a more recent low).
Drawing a trendline

This simple adjustment has made a much more accurate fit for our trendline analysis and we can confidently use it. Just be careful not to move your trendline around with bias making it fit your sentiment. Only very minor adjustments are allowed.

Trend Lines on Point & Figure (P&F) Charts

Because of the nature of Point and Figure charts, trendlines will be drawn at 45 degree angles.

  • If it is an uptrend, start at the lowest column of O’s and draw a 45 degree angle up.
  • If the trend is a downward one, start at the top of the highest row of X’s and draw a 45 degree angle downward.
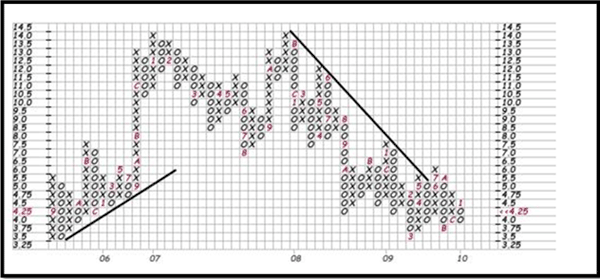
Drawing trendline on a Point & Figure Chart

As you can see, drawing trendlines is quite simple on the P&F chart. In fact, many online charting sites will even draw the lines on for you.

Series: Previous | Next
technical analysis charting
You May Also Like
  • Buying and Selling With the Trend
  • Intermediate Setups and Creating a Bias Part 1
  • Trend Following Indicators - Part 3: The Directional Movement Index (DMI)
  • Technical Analysis: The Secret of Moving Averages Explained
  • Learn How To Trade Support and Resistance Levels
About Privacy Contact v2.0.1
© 2025 The Domain Publisher Pty Ltd.
This website uses cookies to ensure you get the best experience on our website. Learn more about cookies